How to track your school's activity in Flat for Education
Last updated November 9, 2026
The Usage Dashboard helps school and district admins answer the questions that usually take a round of emails: Are teachers using Flat for Education? Which classes are most active? Are all our licenses being used? In this guide, you will learn where to find the dashboard and which tab to open for each question.
Available with the School & District plan.
Your whole school's music activity, on one page.
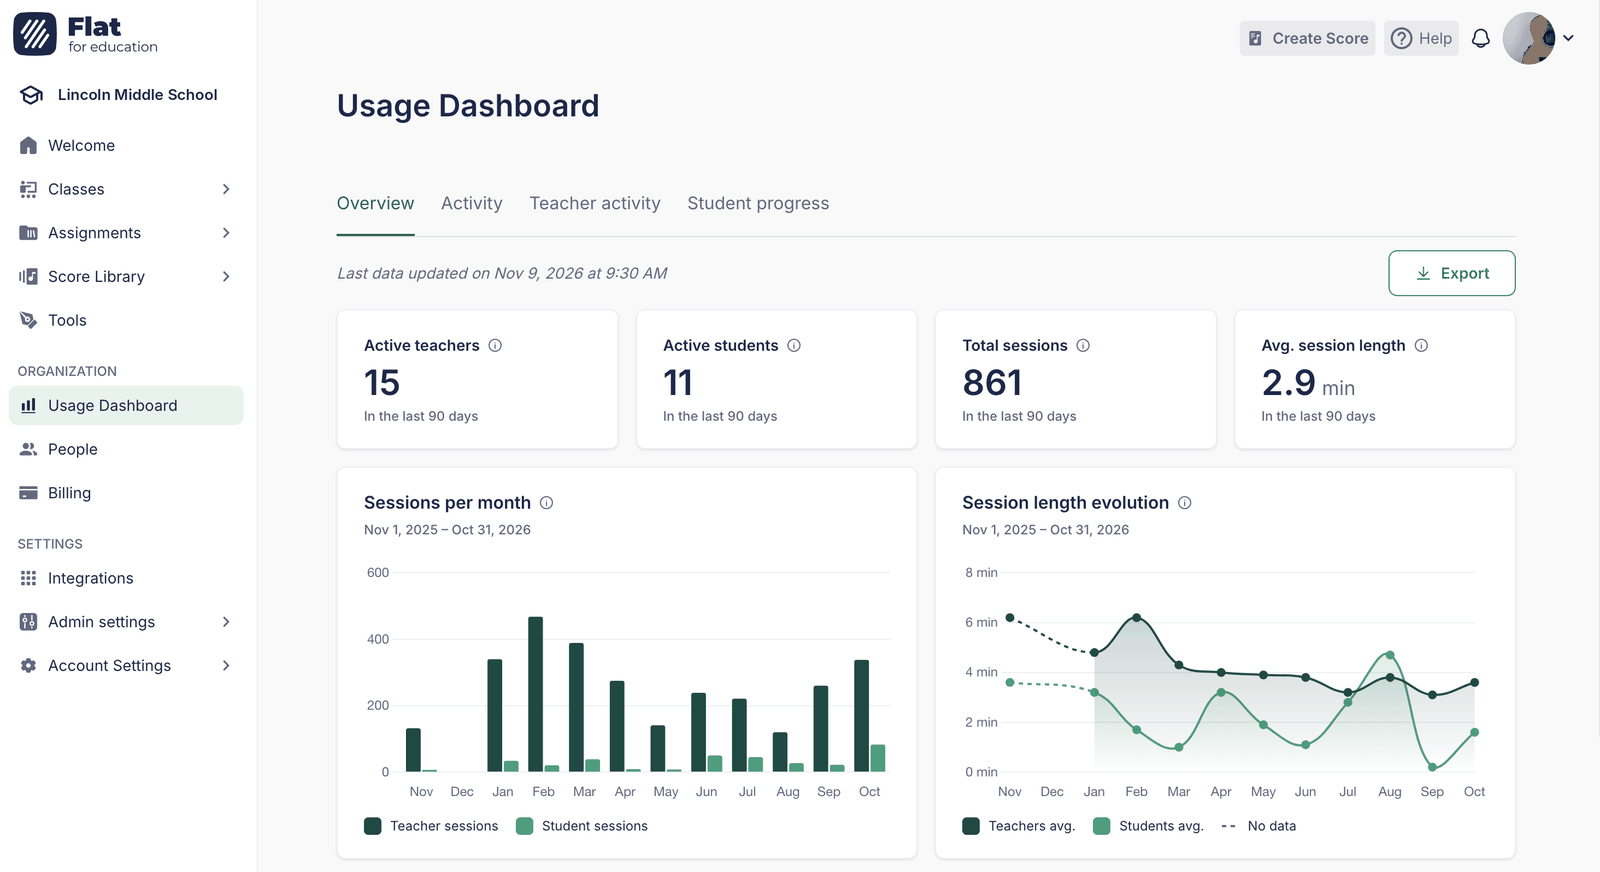
See at a glance who's using Flat for Education, which classes are busiest, how students are doing and where your licenses go. The figures refresh every day, so you can check in whenever you need to.
Which tab answers your question
| If you want to know… | Open this tab |
|---|---|
| Whether Flat for Education is being used across the school, and how that changes through the year | Overview |
| Which classes are the most active, and where students are falling behind or struggling | Activity |
| Which teachers use Flat for Education the most, who hasn't started yet, and whether all your licenses are in use | Teacher activity |
| How one student is doing, assignment by assignment | Student progress |
Who can use the Usage Dashboard
The Usage Dashboard is for people who manage the school account:
| Role | Access |
|---|---|
| Admin | Yes |
| Support Admin | Yes |
| Teacher | No |
| Student | No |
See roles and permissions for everything each role can do.
Open the Usage Dashboard
In the left menu, under Organization, click Usage Dashboard. The dashboard opens on the Overview tab. From there, switch between the four tabs depending on what you want to find out.
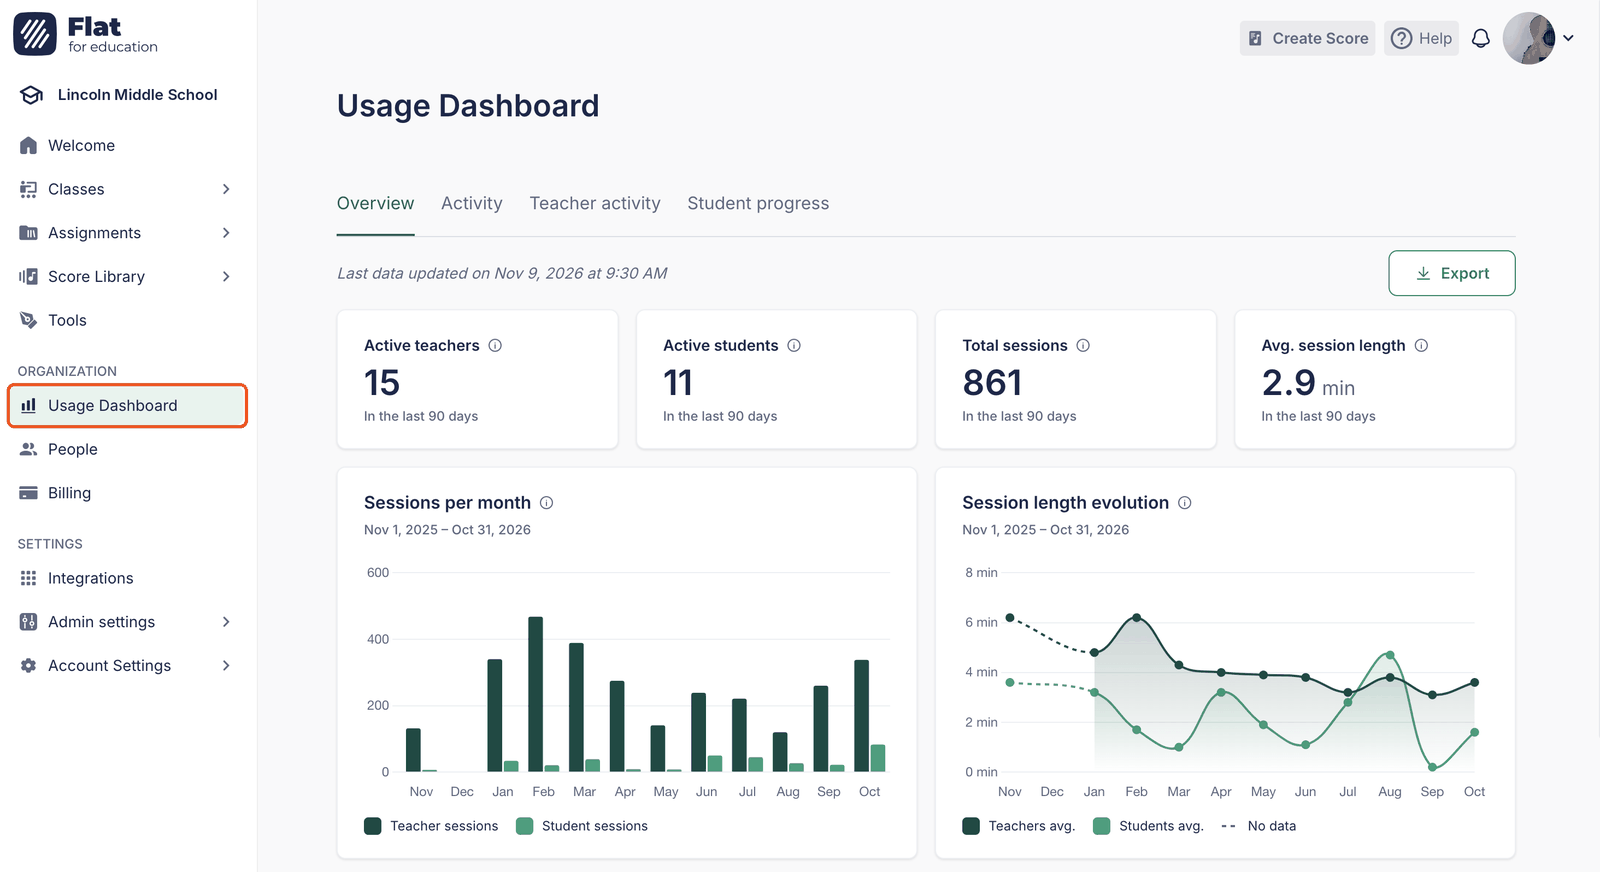
Not sure what a figure means? Hover over the ⓘ icon next to any title to see how it's calculated.
Overview: is Flat for Education being used?
Start here when you want the big picture, for example a few weeks after rolling out Flat for Education, or before a budget or renewal conversation.
- How many people are using it?
Active teachers and Active students tell you how many people used Flat for Education in the last 90 days. If the numbers are lower than the people you've invited, some teachers may need a hand getting started. - How often and for how long?
Total sessions and Avg. session length show how much time your school spends in Flat for Education. - How does use change through the year?
Sessions per month shows your busiest and quietest months over the last year, so you can spot the dip over breaks or the rise around concert season. If student sessions stay far below teacher sessions, students may not be doing much work in Flat for Education yet. That can be a good moment to suggest assignments to your teachers. - Are sessions getting longer or shorter?
Session length evolution shows the trend for teachers and students. A dashed line means there was no data for those months.
Activity: which classes are most active and how students are doing
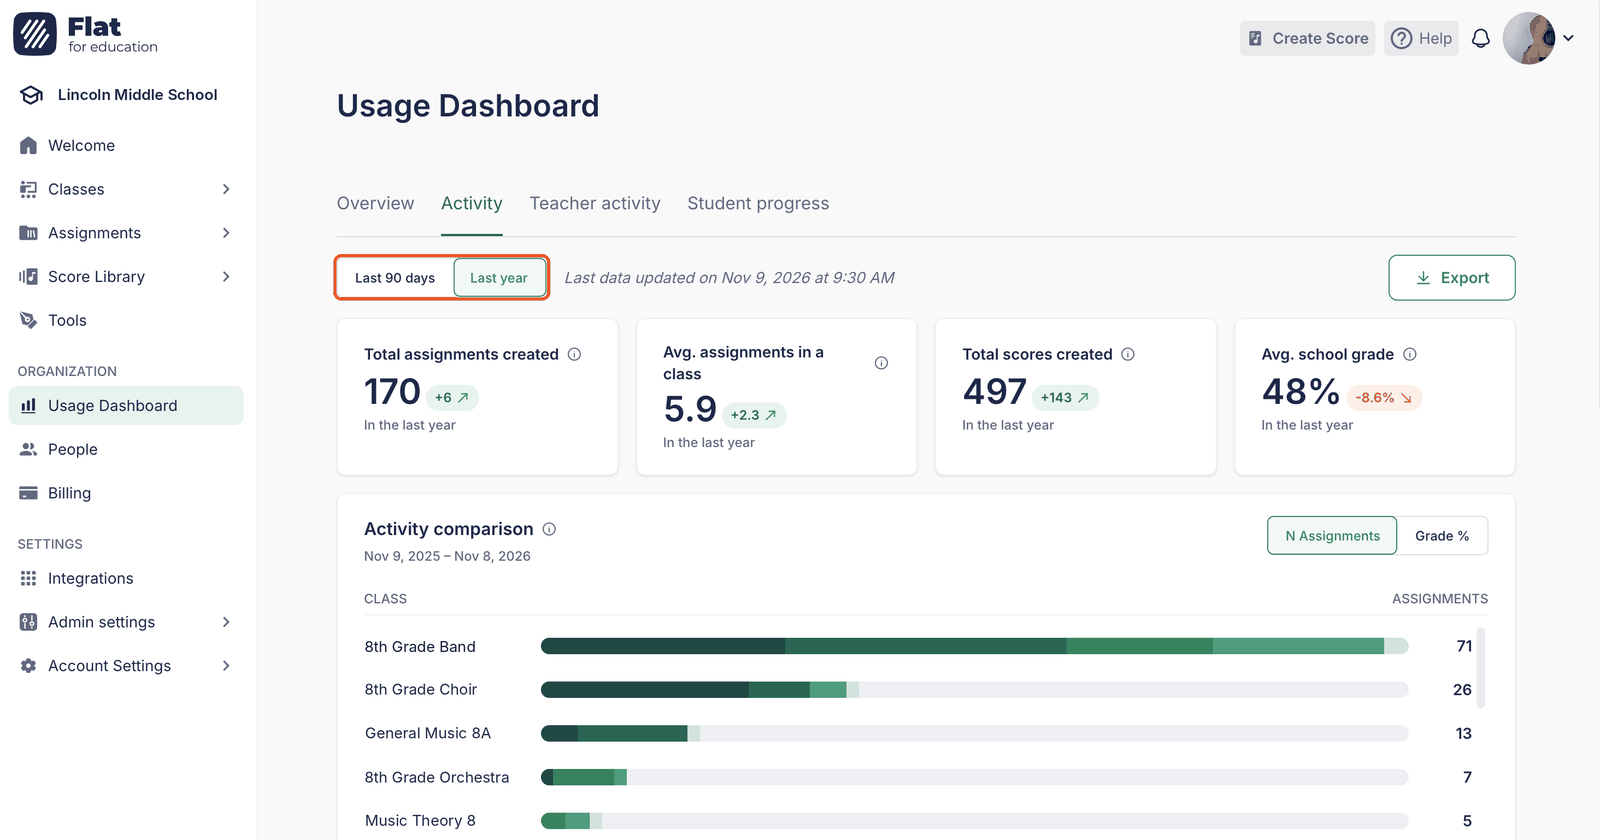
Open the Activity tab when you want to know how much music work is happening and how students are getting on. Use the period switch at the top to look at the Last 90 days or the Last year.
Is the school doing more than before?
The four figures at the top (Total assignments created, Avg. assignments in a class, Total scores created and Avg. school grade) each show the change since the previous period. They're a quick way to show progress in an end-of-term or end-of-year report.
Which classes are the most active?
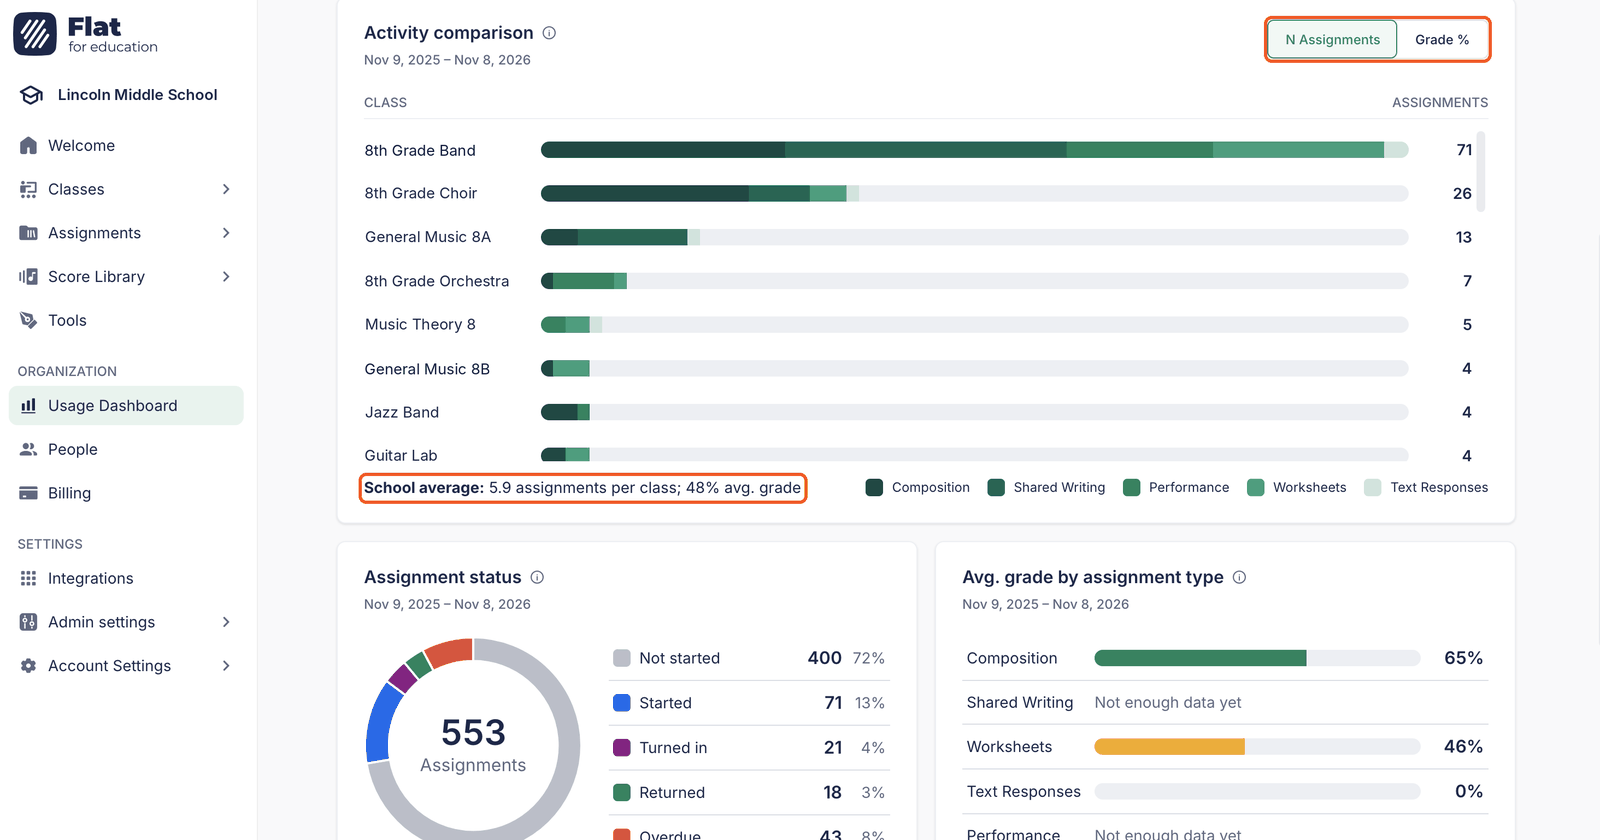
Activity comparison ranks your classes, so you can see right away which ones use Flat for Education the most and which ones might need encouragement. Each bar is split by assignment type, which tells you what kind of work each class does: lots of Worksheets, or more Composition and Performance? Click Grade % to rank classes by average grade instead, and N Assignments to go back. Compare any class with the School average line underneath.
Are students keeping up with their work?
Assignment status shows how much student work is Not started, Started, Turned in, Returned or Overdue. A large share of overdue or not-started work is worth raising with your teachers, for example to adjust due dates or check that students know where to find their assignments.
Where do students struggle?
Avg. grade by assignment type tells you which kinds of work students do well on and which they find harder. For example, if Performance grades are much lower than Composition grades, it may be worth sharing practice tips or more performance assignments. You'll see Not enough data yet for types your teachers haven't graded much. That's completely normal.
Teacher activity: who is using Flat for Education, and your licenses
Open the Teacher activity tab when you want to see which teachers use Flat for Education the most, who hasn't started yet, and how your licenses are being used.
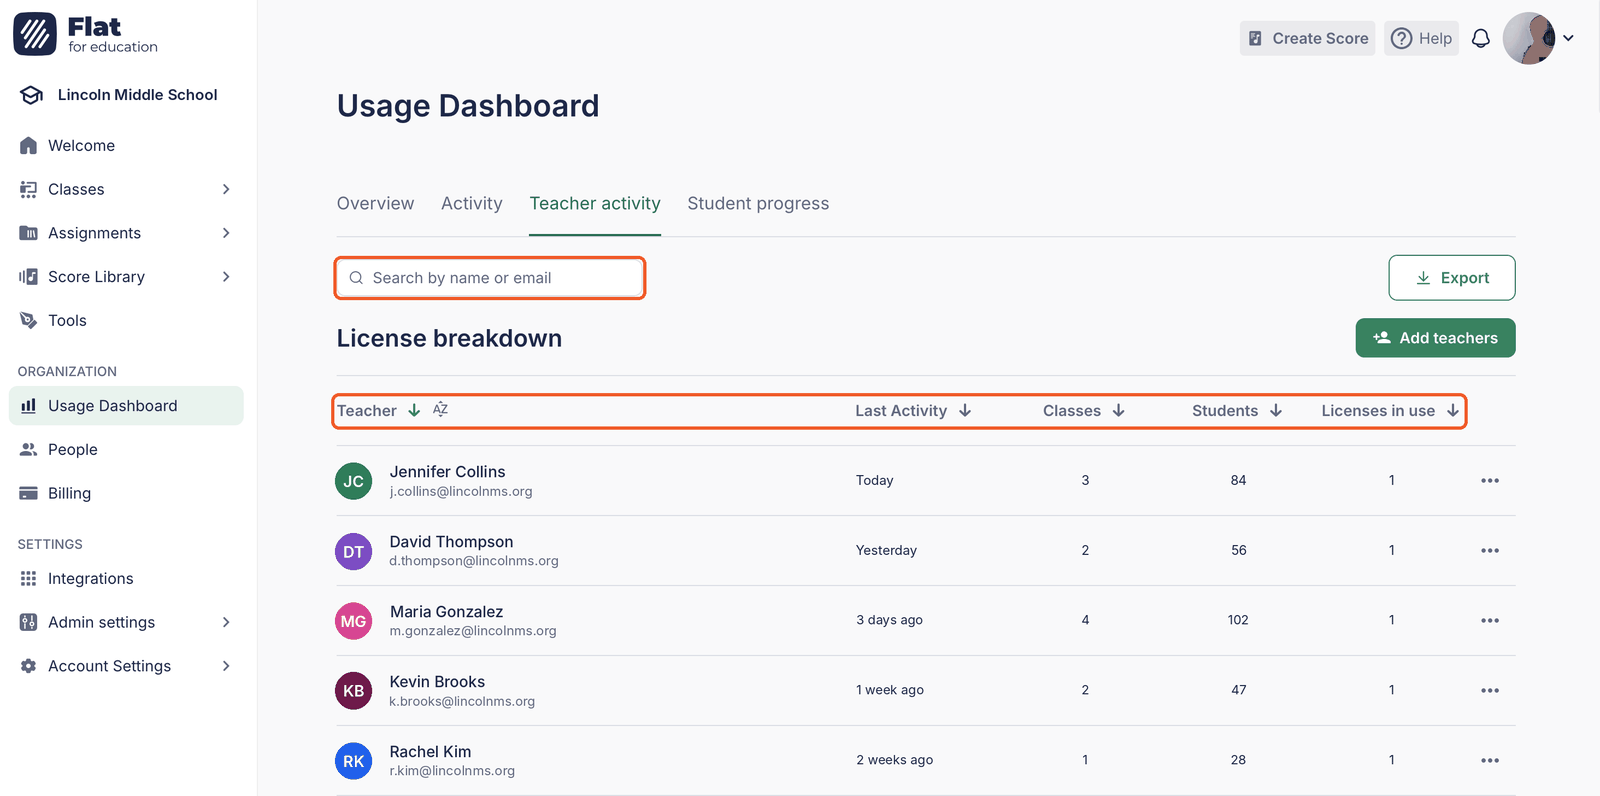
Click any column title to sort the License breakdown table, depending on what you want to know:
- Who uses it the most, or the least? Sort by Last Activity to see who was active recently and who hasn't logged in for a while. A quick check-in with a teacher who hasn't started often helps more than a reminder email.
- Who has the biggest workload? Sort by Classes or Students to see which teachers manage the most classes and students.
- Are all your licenses in use? Licenses in use shows how many licenses each teacher uses. Teachers with no recent activity may be holding a license someone else could use.
To find a specific teacher, use the search bar. When you need more seats for new staff, click Add teachers.
Student progress: check on a single student
Open the Student progress tab when you need to know how a particular student is doing, for example before a parent meeting or when a teacher raises a concern.
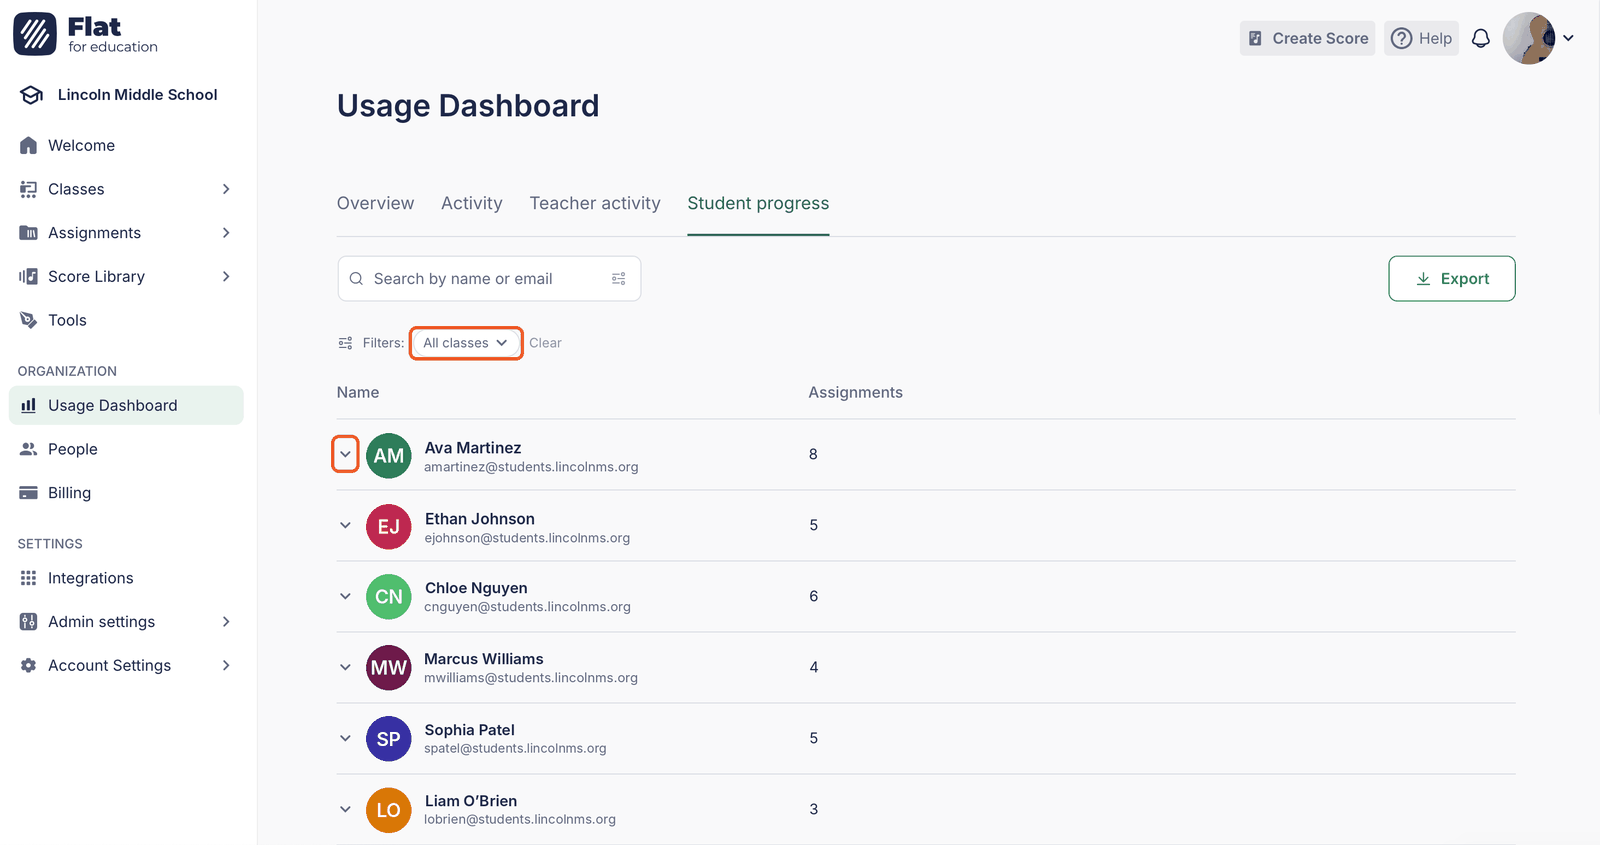
Find the student with the search bar, or use the All classes filter to see the students of one class. Then click the arrow next to their name to see every assignment they've received.
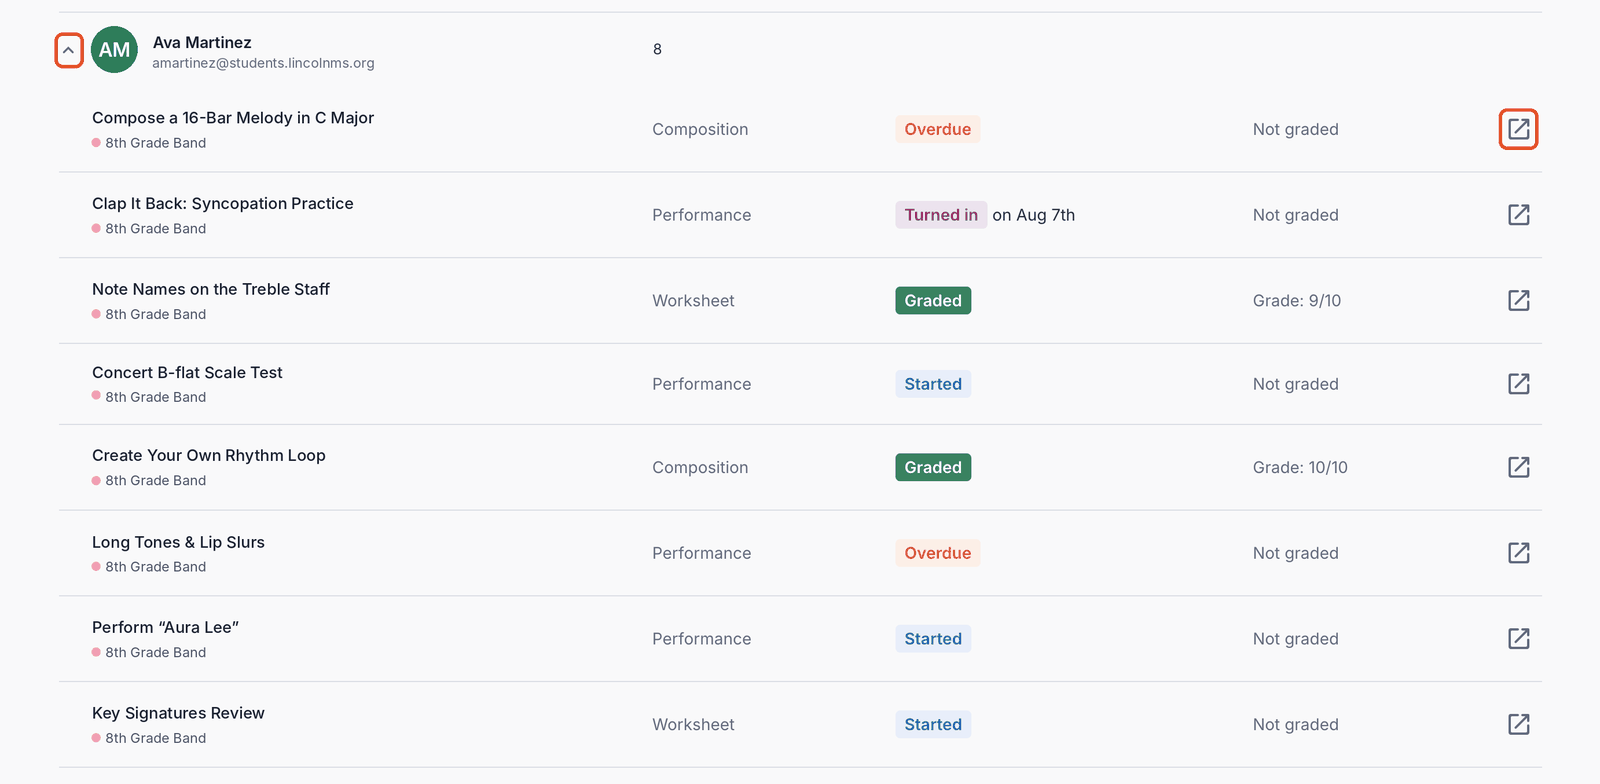
For each assignment, you'll see the class, the type, where their work stands (Started, Turned in, Overdue or Graded) and their grade. This makes it easy to spot overdue work or a pattern across assignment types. To look at what the student actually wrote or recorded, click the open icon at the end of the row.
Share the figures as a PDF
Need to show the figures to your principal, a school board or your budget committee? Click Export at the top right of any tab, then choose Export as PDF. The PDF shows the tab as it appears on screen, with the period and filters you selected.
Export creates a PDF of the tab you're viewing. To share several tabs, open each one and export it separately.
Frequently asked questions
Why do I see an upgrade screen instead of the dashboard?
The Usage Dashboard is included in the School & District plan. Compare plans or contact our team to learn more about upgrading.
Why does the dashboard say the data is being prepared?
The figures are calculated once a day. If your school just got access, check back tomorrow and your data will be there.
Why isn't today's activity showing?
The dashboard is updated once a day, so today's activity will appear after the next update. Check the Last data updated on… line to see when it last ran.